


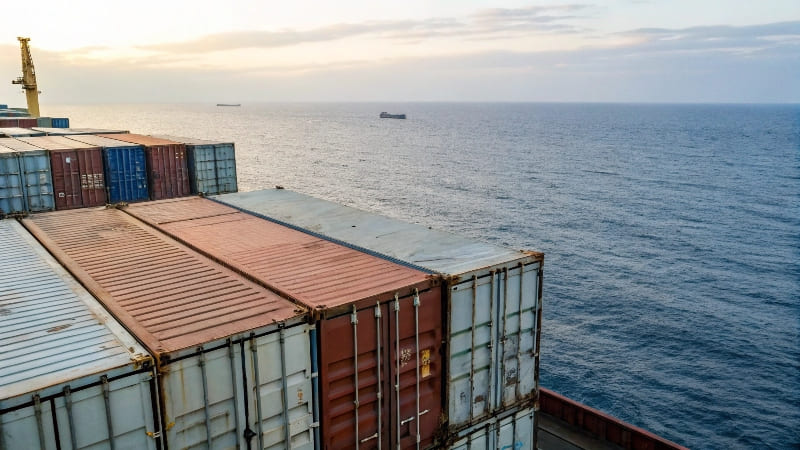
What Happens if You Find a Shipping Container at Sea?
If you find a shipping container at sea, it remains property of the shipping line or leasing company, must be reported to maritime authorities, and typically becomes a salvage recovery operation with potential compensation for the finder.
Maritime law establishes container ownership remains with shipping company even when lost overboard or floating at sea. Salvage rights apply to recovery operations with compensation ranging 10-25% of container and cargo value. Immediate reporting to Coast Guard is mandatory including GPS coordinates, container markings, and hazard assessment. Container identification numbers enable ownership tracking through international shipping databases and insurance records. Recovery operations require specialized equipment and coordination with maritime authorities for safe removal from shipping lanes.
From my extensive experience in container sales and logistics, I've observed that floating containers represent complex intersections of maritime law, insurance claims, and global asset management systems rather than simple abandoned property situations.
What Happens When Containers are Lost at Sea?
When containers are lost at sea, shipping companies initiate insurance claims, conduct environmental risk assessments, issue navigation warnings, and attempt recovery operations while tracking impacts on global supply chains.
Annual container losses average 1,500-2,000 units globally with severe weather accounting for 70-80% of incidents. Insurance claims process begins immediately with total loss declarations averaging $50,000-150,000 per container depending on cargo value and recovery feasibility. Environmental impact assessment evaluates cargo hazards including chemical spills, plastic pollution, and marine ecosystem damage. Navigation warnings alert maritime traffic through NAVTEX broadcasts and shipping advisories for collision avoidance and safety. Supply chain disruption analysis tracks cargo delays affecting manufacturing schedules and delivery commitments across multiple industries and regions.
Loss Statistics and Patterns
Container losses at sea follow predictable patterns based on weather conditions and shipping routes.
| Loss Category | Annual Average | Primary Causes | Seasonal Patterns | Recovery Rate |
|---|---|---|---|---|
| Weather-Related | 1,200-1,600 units | Rough seas, storms | Winter months | 5-15% |
| Ship Incidents | 200-400 units | Groundings, collisions | Year-round | 20-40% |
| Cargo Shifting | 100-200 units | Poor securing | All seasons | 10-25% |
| Equipment Failure | 50-150 units | Lashing failure | Variable | 15-30% |
| Human Error | 25-100 units | Loading mistakes | Consistent | 30-50% |
Weather-related losses dominate container loss statistics with winter months showing highest risk.
Insurance and Claims Process
Complex insurance mechanisms handle container loss financial impacts and recovery decisions.
| Insurance Type | Coverage Scope | Claim Process | Typical Settlement | Recovery Requirements |
|---|---|---|---|---|
| Marine Cargo | Cargo value | 30-90 days | 80-100% of value | Proof of loss |
| Container Hull | Box replacement | 60-120 days | $3,000-8,000 | Container ID verification |
| General Average | Shared losses | 12-24 months | Proportional | Contribution assessment |
| P&I Insurance | Liability coverage | 90-180 days | Variable limits | Third-party claims |
| Environmental | Pollution cleanup | 6-36 months | Actual costs | Regulatory compliance |
Marine cargo insurance provides the most comprehensive coverage for container loss incidents.
Environmental Impact Assessment
Lost containers create significant environmental concerns requiring immediate evaluation and response.
| Environmental Factor | Risk Level | Assessment Timeline | Mitigation Measures | Long-term Impact |
|---|---|---|---|---|
| Hazardous Cargo | High | Immediate | Emergency response | Decades |
| Plastic Pollution | Medium | Days to weeks | Recovery efforts | Years to decades |
| Marine Life Impact | Medium | Weeks to months | Monitoring programs | Variable |
| Coastal Contamination | Variable | Hours to days | Beach cleanup | Months to years |
| Navigation Hazards | High | Immediate | Warning systems | Until recovered |
Hazardous cargo releases require immediate emergency response and long-term monitoring.
Do Empty Shipping Containers Go Back to China?
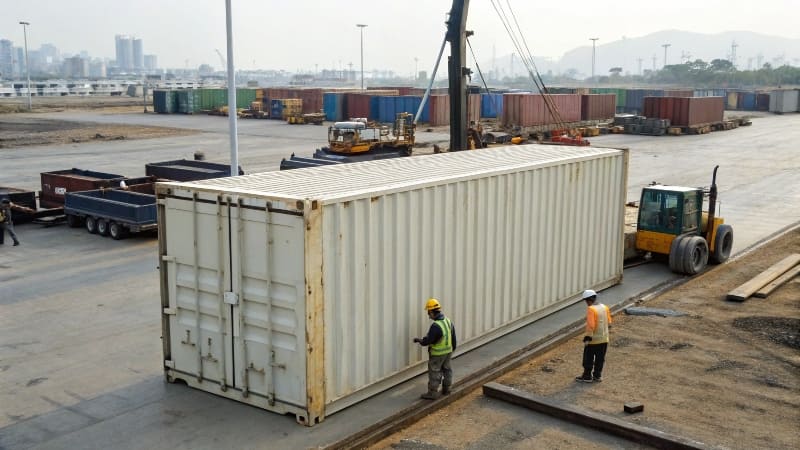
Empty shipping containers follow global repositioning strategies based on trade imbalances, with only profitable routes returning to China while others are sold, stored, or repurposed locally to minimize transportation costs.
Global trade imbalances create 40% empty container movements with China receiving 60-70% of repositioned empties due to export manufacturing demand. Repositioning costs average $800-1,500 per container making some routes economically unviable for return shipments. Regional storage and sales programs handle surplus empties in import-heavy markets including North America and Europe. Container leasing companies optimize positioning through predictive analytics and demand forecasting for maximum utilization efficiency. Alternative end-of-life solutions include conversion for construction, storage, and housing applications providing higher value than return shipping.
Trade Imbalance Impact
Global trade flows create significant empty container positioning challenges requiring strategic management.
| Trade Route | Import/Export Ratio | Empty Repositioning | Economic Viability | Alternative Solutions |
|---|---|---|---|---|
| Asia to North America | 3:1 import bias | 65% return empty | Marginal | Local sales |
| Asia to Europe | 2.5:1 import bias | 60% return empty | Break-even | Storage programs |
| Intra-Asia Routes | Balanced | 20% return empty | Profitable | Normal operations |
| South America to Asia | 1:3 export bias | 80% return loaded | Highly profitable | Standard practice |
| Africa to Asia | 1:2 export bias | 70% return loaded | Profitable | Regular operations |
Import-biased routes create the most challenging empty container positioning economics.
Repositioning Cost Analysis
Transportation costs significantly influence empty container movement decisions.
| Route Type | Distance (km) | Fuel Cost | Port Charges | Total Cost/TEU | Economic Threshold |
|---|---|---|---|---|---|
| Trans-Pacific | 11,000 | $400-600 | $200-400 | $800-1,200 | $1,500 new box |
| Trans-Atlantic | 8,000 | $300-500 | $150-350 | $600-1,000 | $1,200 new box |
| Asia-Middle East | 6,000 | $250-400 | $100-250 | $500-800 | $1,000 new box |
| Intra-Regional | 2,000 | $100-200 | $50-150 | $200-400 | $600 new box |
| Coastal Feeder | 500 | $50-100 | $25-75 | $100-200 | $400 new box |
Trans-Pacific repositioning approaches new container purchase costs making local solutions attractive.
Alternative Utilization Strategies
Shipping lines employ various strategies to optimize empty container management beyond simple repositioning.
| Strategy | Implementation | Cost Savings | Market Applications | Success Rate |
|---|---|---|---|---|
| Local Sales | Direct to market | 60-80% cost reduction | Construction, storage | 85-95% |
| Conversion Programs | Modification services | 40-60% cost reduction | Housing, offices | 70-85% |
| Storage Leasing | Regional depots | 30-50% cost reduction | Seasonal demand | 90-95% |
| Equipment Interchange | Carrier cooperation | 20-40% cost reduction | Operational efficiency | 60-80% |
| Scrap and Recycle | Material recovery | 10-30% cost reduction | Steel production | 95-100% |
Local sales programs provide the most effective alternative to expensive repositioning.
Who Pays for Containers Lost at Sea?
Container losses at sea are typically covered by marine insurance policies held by shipping lines, cargo owners, or leasing companies, with costs distributed through general average contributions and specialized maritime insurance mechanisms.
Shipping line marine insurance covers 80-90% of container losses through hull and machinery policies with deductibles ranging $25,000-100,000 per incident. Cargo owner marine cargo insurance covers contents value independent of container loss with separate claims processes and settlements. General average contributions distribute major losses among all cargo interests on the voyage based on proportional cargo values. Container leasing company insurance covers equipment replacement costs for leased containers under specialized policies. Environmental cleanup costs require P&I insurance coverage for pollution liability and third-party damages.
Insurance Coverage Structure
Complex insurance arrangements cover different aspects of container loss at sea.
| Insurance Type | Coverage Scope | Policy Holder | Typical Limits | Deductible Range |
|---|---|---|---|---|
| Hull & Machinery | Vessel and equipment | Shipping line | $50M-500M | $25K-250K |
| Marine Cargo | Cargo contents | Cargo owner | $1M-100M | $1K-25K |
| P&I Insurance | Third-party liability | Shipping line | $1B+ | $10K-100K |
| Container Equipment | Box replacement | Leasing company | $10M-100M | $5K-50K |
| General Average | Shared voyage losses | All interests | Voyage value | Proportional |
Hull and machinery insurance provides primary coverage for container loss incidents.
Claims Settlement Process
Container loss claims follow established maritime law procedures with multiple stakeholders involved.
| Settlement Phase | Timeline | Stakeholders | Documentation Required | Typical Outcomes |
|---|---|---|---|---|
| Initial Notification | 24-48 hours | All parties | Loss report, position | Claim registration |
| Loss Adjustment | 30-90 days | Adjusters, experts | Survey, investigation | Liability determination |
| Coverage Determination | 60-120 days | Insurers, lawyers | Policy analysis | Coverage confirmation |
| Settlement Negotiation | 90-180 days | All stakeholders | Damage assessment | Payment agreement |
| Final Payment | 120-365 days | Insurers | Releases, receipts | Claim closure |
Loss adjustment phase represents the most critical period for determining coverage and liability.
Financial Impact Distribution
Container losses create financial impacts distributed across multiple industry participants.
| Financial Responsibility | Typical Allocation | Cost Range | Payment Source | Recovery Options |
|---|---|---|---|---|
| Container Replacement | 100% equipment owner | $3,000-8,000 | Equipment insurance | None typically |
| Cargo Compensation | 100% cargo owner | $5,000-500,000+ | Cargo insurance | Carrier liability |
| Environmental Cleanup | 100% carrier | $10,000-1,000,000+ | P&I insurance | Cost recovery |
| Navigation Hazard | 100% carrier | $5,000-50,000 | P&I insurance | Limited recovery |
| General Average | Proportional all parties | Variable | Shared contribution | None |
Environmental cleanup costs often represent the largest single expense in container loss incidents.
Liability Limitations and Exceptions
Maritime law provides specific liability limitations and exceptions affecting container loss responsibility.
| Legal Framework | Liability Limit | Coverage Exceptions | Geographic Scope | Enforcement Authority |
|---|---|---|---|---|
| Hague-Visby Rules | SDR 666.67/package | Navigation errors | International | Flag state |
| Hamburg Rules | SDR 835/package | Limited exceptions | Ratifying states | Port state |
| Rotterdam Rules | SDR 875/package | Modern framework | Future adoption | Contracting states |
| US COGSA | $500/package | Fire, perils of sea | US trades | US courts |
| National Variations | Variable limits | Local provisions | Domestic trades | Local jurisdiction |
Hague-Visby Rules govern most international container loss liability determinations.
Conclusion
Finding a shipping container at sea involves maritime law where ownership remains with shipping company requiring immediate Coast Guard reporting with GPS coordinates and potential salvage compensation of 10-25% container value through specialized recovery operations. Container losses at sea average 1,500-2,000 units annually with 70-80% weather-related incidents triggering insurance claims of $50,000-150,000 per container and environmental impact assessments for cargo hazards plus navigation warnings for maritime safety. Empty containers follow global repositioning strategies with 60-70% returning to China due to export demand but repositioning costs of $800-1,500 per container making local sales and conversion programs more economical for import-heavy markets. Container losses are covered by marine insurance with shipping line hull and machinery policies covering 80-90% of losses while cargo owners maintain separate marine cargo insurance and general average contributions distribute major losses among all voyage participants proportionally. Success in understanding maritime container issues requires recognizing the complex intersection of international maritime law, global trade imbalances, specialized insurance mechanisms, and environmental responsibilities, with financial impacts distributed across multiple stakeholders through established legal frameworks rather than simple ownership or finder's rights principles.
