




How Many 20ft Containers Can A Ship Carry?
Container ship capacity ranges from 1,000 to 24,000 TEU (Twenty-foot Equivalent Units), with modern ultra-large container vessels (ULCV) carrying 15,000-24,000 TEU, though actual loading depends on weight limits, port restrictions, and cargo mix optimization.
Ship capacity represents theoretical maximum that varies significantly based on operational constraints and cargo characteristics.
TRUSUS shipping capacity insight: container ship loading involves complex optimization balancing TEU capacity, weight limits, port restrictions, and cargo distribution requirements for operational efficiency.
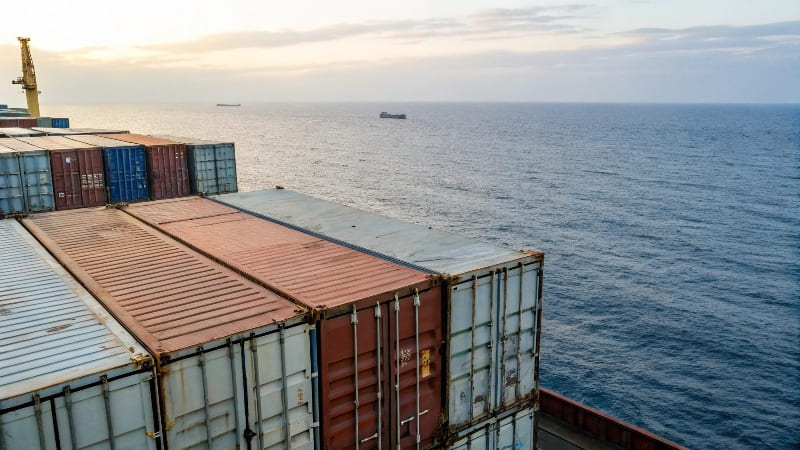
I increasingly see logistics professionals require detailed understanding of ship capacity factors as supply chain optimization becomes more sophisticated and cost-critical.
Understanding capacity limitations enables better logistics planning and shipping cost optimization.
Ship Size Classifications
| Ship Category | TEU Capacity | Length | Typical Routes |
|---|---|---|---|
| Feeder ships | 1,000-3,000 | 150-200m | Regional/short-haul |
| Large container ships | 8,000-14,999 | 300-365m | Major trade routes |
| Ultra Large Container Vessels | 15,000-24,000+ | 365-400m+ | Asia-Europe/Transpacific |
| Mega ships | 20,000+ TEU | 395-400m+ | High-volume corridors |
Different ship sizes serve specific trade routes and cargo volume requirements.
Capacity Constraint Analysis
| Constraint Factor | Impact on Loading | Optimization Strategy | Operational Effect |
|---|---|---|---|
| Weight limits | Reduces TEU utilization | Cargo mix optimization | 60-85% TEU utilization |
| Port depth restrictions | Limits ship size/draft | Route planning | Payload limitations |
| Crane reach limitations | Loading pattern constraints | Bay planning | Efficiency impact |
| Stability requirements | Container distribution | Load planning | Safety compliance |
Multiple constraints prevent ships from achieving theoretical maximum TEU capacity.
Actual vs Theoretical Capacity
| Ship Size | Theoretical TEU | Typical Utilization | Actual Average Loading |
|---|---|---|---|
| 10,000 TEU | 10,000 | 75-85% | 7,500-8,500 TEU |
| 15,000 TEU | 15,000 | 70-80% | 10,500-12,000 TEU |
| 20,000 TEU | 20,000 | 65-75% | 13,000-15,000 TEU |
| 24,000 TEU | 24,000 | 60-70% | 14,400-16,800 TEU |
Larger ships typically achieve lower capacity utilization due to operational constraints.
Container Mix Optimization
| Container Type | TEU Equivalent | Weight Characteristics | Loading Priority |
|---|---|---|---|
| 20ft standard | 1.0 TEU | Higher weight/TEU ratio | Heavy cargo preference |
| 40ft standard | 2.0 TEU | Lower weight/TEU ratio | Light/bulky cargo |
| 40ft high cube | 2.25 TEU | Lowest weight/TEU ratio | Maximum volume cargo |
| 45ft containers | 2.25-2.5 TEU | Variable characteristics | Specialized cargo |
Container mix affects total TEU utilization and weight distribution.
Port Infrastructure Impact
| Port Limitation | Capacity Impact | Mitigation Strategy | Cost Implication |
|---|---|---|---|
| Water depth | Draft restrictions | Partial loading | Reduced efficiency |
| Crane specifications | Loading/unloading speed | Port selection | Time costs |
| Berth length | Ship size limits | Smaller vessels | Capacity trade-offs |
| Yard capacity | Container storage | Scheduling coordination | Operational delays |
Port infrastructure directly affects achievable ship capacity utilization.
Economic Optimization
| Economic Factor | Impact on Capacity | Decision Criteria | Profit Optimization |
|---|---|---|---|
| Fuel costs | Speed/capacity trade-off | Route optimization | Cost per TEU mile |
| Port charges | Loading time vs costs | Efficiency balance | Total voyage costs |
| Cargo rates | High vs low value cargo | Revenue optimization | Profit per TEU |
| Schedule reliability | Capacity vs timing | Service quality | Customer satisfaction |
Economic considerations influence capacity utilization decisions beyond pure TEU maximization.
Why Capacity Understanding Matters
| Basic TEU Awareness | Comprehensive Capacity Analysis |
|---|---|
| Theoretical maximum focus | Operational reality understanding |
| Simple capacity assumptions | Complex constraint recognition |
| Generic shipping planning | Optimized logistics decisions |
Understanding real capacity constraints enables better shipping planning and cost optimization.
The Industry Shift Behind Capacity Questions
| Traditional Shipping Approach | Modern Capacity Optimization |
|---|---|
| Maximum TEU utilization focus | Balanced operational efficiency |
| Single-factor capacity planning | Multi-constraint optimization |
| Generic shipping solutions | Route-specific capacity strategies |
I increasingly see logistics professionals implement sophisticated capacity analysis that considers TEU limits, weight constraints, port restrictions, and economic optimization for efficient shipping operations.
How Long Does It Take To Unload A 20,000 Container Ship?
Unloading a 20,000 TEU container ship typically requires 18-36 hours depending on port automation level, crane quantity, cargo mix, and operational efficiency, with modern automated terminals achieving 40-50 moves per crane per hour.
Unloading time directly impacts vessel turnaround, port costs, and shipping schedule reliability.
TRUSUS port operations insight: container ship unloading involves complex orchestration of equipment, labor, and logistics coordination with efficiency varying significantly by port infrastructure and automation level.
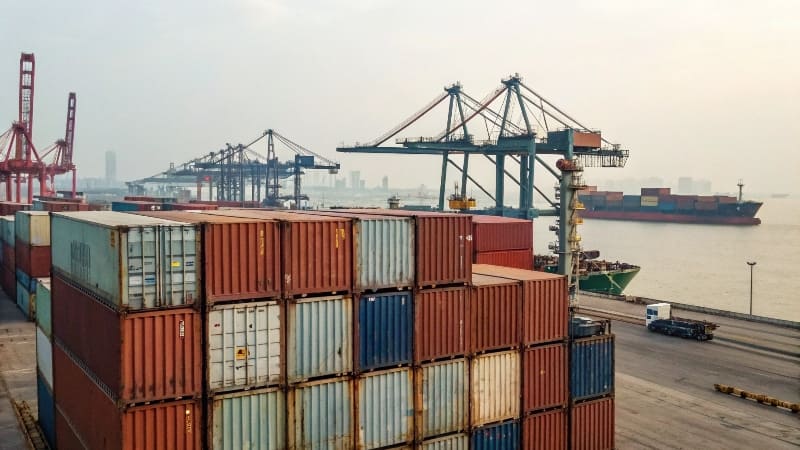
I increasingly see shipping operations focus on port efficiency optimization as vessel sizes increase and schedule pressure intensifies in global trade.
Understanding unloading factors enables better port selection and logistics planning for shipping operations.
Port Equipment Performance
| Equipment Type | Moves per Hour | Typical Quantity | Total Hourly Capacity |
|---|---|---|---|
| Manual gantry cranes | 20-30 moves | 4-6 cranes | 80-180 moves/hour |
| Semi-automated cranes | 30-40 moves | 6-8 cranes | 180-320 moves/hour |
| Fully automated cranes | 40-50 moves | 8-12 cranes | 320-600 moves/hour |
| High-efficiency terminals | 45-60 moves | 10-16 cranes | 450-960 moves/hour |
Crane technology and quantity directly determine unloading speed and efficiency.
Operational Time Breakdown
| Operation Phase | Time Allocation | Efficiency Factors | Optimization Opportunities |
|---|---|---|---|
| Vessel positioning | 2-4 hours | Pilot/tug availability | Port scheduling coordination |
| Crane setup | 1-2 hours | Equipment preparation | Pre-arrival planning |
| Container operations | 15-30 hours | Crane efficiency/cargo mix | Equipment optimization |
| Final procedures | 1-3 hours | Documentation/inspection | Process streamlining |
Different operational phases contribute varying time components to total unloading duration.
Cargo Mix Impact
| Container Distribution | Unloading Complexity | Time Impact | Efficiency Consideration |
|---|---|---|---|
| Full discharge | Simple operations | Minimum time | Optimal crane utilization |
| Partial discharge | Selective handling | Moderate time | Bay planning required |
| Mixed operations | Load/discharge combo | Maximum time | Complex coordination |
| Transshipment cargo | Hub operations | Variable time | Network optimization |
Cargo operations complexity significantly affects total unloading time requirements.
Port Infrastructure Variables
| Infrastructure Factor | Performance Impact | Efficiency Range | Investment Requirement |
|---|---|---|---|
| Automated yard systems | High efficiency | 50-100% improvement | High capital investment |
| Advanced crane systems | Moderate efficiency | 20-40% improvement | Moderate investment |
| Digital coordination | Operational optimization | 10-25% improvement | Technology investment |
| Workforce training | Skill enhancement | 5-15% improvement | Training investment |
Infrastructure quality and automation level directly affect operational efficiency.
Time Calculation Example
| Ship Size | Container Count | Crane Hours | Total Duration | Port Efficiency |
|---|---|---|---|---|
| 20,000 TEU | 15,000 actual | 6 cranes × 25 hours | 30 hours total | Standard terminal |
| 20,000 TEU | 15,000 actual | 8 cranes × 20 hours | 24 hours total | Efficient terminal |
| 20,000 TEU | 15,000 actual | 12 cranes × 15 hours | 18 hours total | Automated terminal |
Crane quantity and efficiency determine actual unloading timeframes.
Efficiency Optimization Strategies
| Optimization Method | Time Savings | Implementation Cost | Operational Benefit |
|---|---|---|---|
| Pre-arrival planning | 10-20% | Low cost | Better coordination |
| Equipment optimization | 15-25% | Moderate cost | Higher throughput |
| Process automation | 25-40% | High cost | Consistent performance |
| Workforce enhancement | 5-15% | Training cost | Skill improvement |
Different optimization approaches provide varying efficiency gains at different cost levels.
Cost Impact Analysis
| Delay Factor | Cost per Hour | 24-Hour Impact | Economic Consequence |
|---|---|---|---|
| Vessel charter | $1,000-3,000 | $24,000-72,000 | Direct shipping cost |
| Port charges | $500-1,500 | $12,000-36,000 | Port operation cost |
| Schedule disruption | Variable | High impact | Network effect |
| Cargo delays | Variable | Customer impact | Service quality |
Unloading delays create significant direct costs and operational disruptions.
Why Unloading Time Matters
| Basic Port Selection | Comprehensive Efficiency Analysis |
|---|---|
| Location-focused decisions | Performance-based port choice |
| Cost-only considerations | Time-cost optimization |
| Generic port services | Efficiency-specialized operations |
Understanding unloading efficiency enables optimal port selection and logistics planning.
The Industry Shift Behind Timing Questions
| Traditional Port Operations | Modern Efficiency Optimization |
|---|---|
| Basic container handling | Automated systems integration |
| Manual coordination | Digital orchestration |
| Standard operating procedures | Continuous improvement focus |
I increasingly see shipping operations implement comprehensive port efficiency analysis that optimizes vessel turnaround, operational costs, and schedule reliability through advanced port selection and coordination strategies.
Why Can't A 40ft Container Carry Twice The Weight Of A 20ft?
40ft containers cannot carry twice the weight of 20ft containers due to structural engineering limitations including increased bending stress over longer spans, material strength constraints, and handling equipment limitations, resulting in only 27% more payload capacity despite 100% more volume.
Structural physics prevents linear weight scaling with container length increases.
TRUSUS structural engineering insight: container weight limits reflect complex engineering balance between material strength, structural integrity, handling requirements, and safety regulations rather than simple volume scaling.
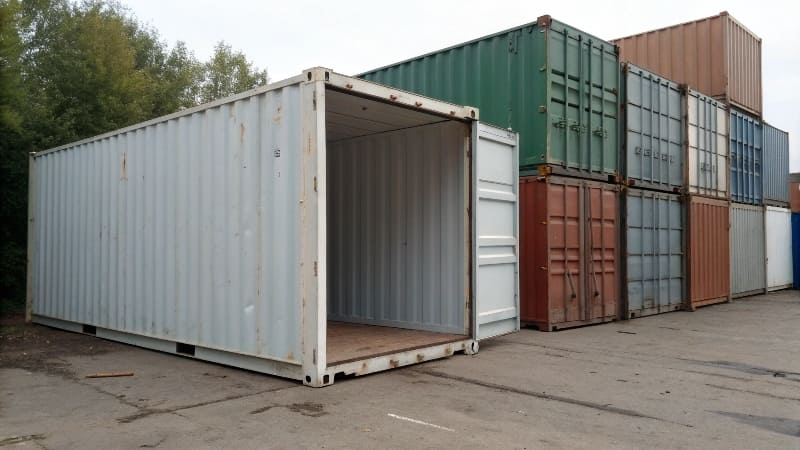
I increasingly see logistics professionals require engineering understanding as cargo optimization becomes more sophisticated and weight distribution critical.
Understanding structural limitations enables better cargo planning and container selection for optimal loading efficiency.
Structural Engineering Principles
| Engineering Factor | 20ft Container | 40ft Container | Scaling Reality |
|---|---|---|---|
| Structural span | 6.1m length | 12.2m length | 100% increase |
| Bending moment | Moderate stress | Quadratic increase | 400% stress increase |
| Material thickness | Standard gauge | Same gauge | No linear scaling |
| Maximum gross weight | 24,000 kg | 30,480 kg | Only 27% increase |
Structural stress increases exponentially with length while material strength remains constant.
Weight Distribution Analysis
| Load Distribution | 20ft Performance | 40ft Performance | Engineering Limitation |
|---|---|---|---|
| Uniform loading | Optimal strength | Acceptable stress | Center span weakness |
| Point loading | Good tolerance | Poor tolerance | Concentration effects |
| End loading | Excellent | Good | Reduced center support |
| Dynamic loading | Stable | More flexible | Increased deflection |
Longer containers experience higher structural stress under identical loading conditions.
Material Strength Constraints
| Material Property | Limitation Factor | Design Impact | Safety Consideration |
|---|---|---|---|
| Steel yield strength | Fixed property | Cannot increase arbitrarily | Safety factor required |
| Wall thickness | Economic constraint | Cost vs strength trade-off | Weight penalty |
| Corner post strength | Critical points | Stress concentration | Failure prevention |
| Floor beam capacity | Span limitations | Deflection control | Structural integrity |
Material properties impose absolute limits on container weight capacity regardless of size.
Handling Equipment Constraints
| Handling System | 20ft Suitability | 40ft Limitations | Equipment Impact |
|---|---|---|---|
| Truck chassis | Standard capacity | Weight distribution | Axle load limits |
| Crane systems | Compact lifting | Extended reach required | Moment limitations |
| Ship cell guides | Precise fit | Longer guide systems | Structural complexity |
| Terminal equipment | Universal handling | Specialized requirements | Equipment limitations |
Container handling systems impose additional weight and structural constraints.
Regulatory Standards
| Regulation Type | Weight Limit Basis | Safety Margin | Compliance Requirement |
|---|---|---|---|
| ISO standards | Engineering analysis | Conservative factors | International compliance |
| Transport regulations | Road/rail limits | Infrastructure protection | Legal requirements |
| Maritime rules | Stability requirements | Vessel safety | Operational compliance |
| Port requirements | Handling capacity | Equipment protection | Terminal operations |
Multiple regulatory frameworks enforce conservative weight limits for safety and compatibility.
Economic Engineering Balance
| Design Factor | Engineering Optimum | Economic Reality | Compromise Result |
|---|---|---|---|
| Material thickness | Heavier construction | Cost minimization | Standard specifications |
| Structural reinforcement | Maximum strength | Weight penalty | Balanced design |
| Manufacturing complexity | Simple construction | Production efficiency | Standardized designs |
| Maintenance requirements | Robust construction | Operational costs | Practical durability |
Container design represents optimal balance between strength, weight, and cost considerations.
Cargo Loading Implications
| Cargo Type | 20ft Optimization | 40ft Optimization | Selection Criteria |
|---|---|---|---|
| Dense cargo | Weight-limited | Underutilized volume | 20ft preferred |
| Light cargo | Volume-limited | Optimal utilization | 40ft preferred |
| Mixed cargo | Balanced loading | Planning required | Load distribution |
| Liquid cargo | Weight distribution | Center support critical | Engineering analysis |
Understanding weight limitations enables optimal container selection for specific cargo types.
Why Structural Understanding Matters
| Volume-Based Assumptions | Engineering-Based Planning |
|---|---|
| Linear scaling expectations | Structural reality recognition |
| Simple capacity calculations | Complex load analysis |
| Generic container selection | Engineering-informed choices |
Understanding structural limitations enables better cargo planning and container utilization.
The Industry Shift Behind Engineering Questions
| Traditional Container Use | Modern Cargo Engineering |
|---|---|
| Basic volume calculations | Structural analysis integration |
| Simple weight assumptions | Engineering constraint recognition |
| Generic loading practices | Optimized cargo distribution |
I increasingly see logistics operations implement engineering-based cargo planning that considers structural limitations, weight distribution, and material constraints for optimal container utilization and safety compliance.
What Is The Difference Between Tare Weight And Payload?
Tare weight represents the empty container weight (2.3 tons for 20ft, 3.8 tons for 40ft) while payload is the maximum cargo weight capacity, with their sum equaling the container's maximum gross weight limit for transportation safety and regulatory compliance.
Understanding weight components enables optimal cargo loading and shipping cost calculation.
TRUSUS weight analysis insight: tare weight and payload represent fundamental shipping economics determining cargo capacity, transportation costs, and loading optimization for efficient logistics operations.

I increasingly see shipping operations require precise weight understanding as cargo optimization becomes critical for cost control and regulatory compliance.
Understanding weight components enables optimal cargo planning and accurate shipping cost calculation.
Weight Component Breakdown
| Container Type | Tare Weight | Maximum Gross Weight | Available Payload | Payload Percentage |
|---|---|---|---|---|
| 20ft standard | 2,300 kg | 24,000 kg | 21,700 kg | 90.4% |
| 40ft standard | 3,800 kg | 30,480 kg | 26,680 kg | 87.5% |
| 40ft high cube | 4,150 kg | 30,480 kg | 26,330 kg | 86.4% |
| 45ft container | 4,800 kg | 30,480 kg | 25,680 kg | 84.3% |
Larger containers have proportionally higher tare weights reducing payload efficiency.
Economic Impact Analysis
| Economic Factor | Tare Weight Impact | Payload Impact | Cost Optimization |
|---|---|---|---|
| Shipping rates | Dead weight cost | Revenue generation | Maximize payload utilization |
| Fuel consumption | Transport penalty | Efficiency optimization | Weight distribution |
| Handling costs | Equipment requirements | Loading efficiency | Container selection |
| Route restrictions | Weight limitations | Cargo capacity | Regulatory compliance |
Weight components directly affect shipping economics and operational efficiency.
Cargo Loading Strategies
| Loading Strategy | Tare Consideration | Payload Optimization | Efficiency Result |
|---|---|---|---|
| Dense cargo | Minimize tare ratio | Maximize weight utilization | High payload efficiency |
| Light cargo | Tare less critical | Volume-limited loading | Lower weight efficiency |
| Mixed cargo | Balance considerations | Weight distribution | Optimized utilization |
| Liquid cargo | Weight distribution | Center of gravity | Stability focus |
Different cargo types require different approaches to tare weight and payload optimization.
Transportation Regulations
| Regulation Type | Weight Limit | Compliance Requirement | Violation Consequence |
|---|---|---|---|
| Road transport | Axle load limits | Gross weight verification | Fines/delays |
| Rail transport | Car capacity limits | Weight distribution | Service restrictions |
| Maritime transport | Vessel stability | Container weight declaration | Safety violations |
| International trade | Customs requirements | Accurate documentation | Regulatory penalties |
Accurate weight understanding ensures regulatory compliance across transport modes.
Cost Calculation Methods
| Calculation Basis | Tare Impact | Payload Benefit | Rate Determination |
|---|---|---|---|
| Weight-based rates | Penalty for tare | Revenue from payload | Per kg pricing |
| Volume-based rates | Minimal impact | Cargo density factor | Per m³ pricing |
| Distance-based rates | Fuel efficiency | Load optimization | Per km pricing |
| Freight class rates | Classification factor | Value optimization | Commodity pricing |
Different rate structures treat tare weight and payload differently in cost calculations.
Operational Optimization
| Optimization Area | Tare Management | Payload Maximization | Efficiency Gain |
|---|---|---|---|
| Container selection | Lightweight options | Capacity matching | Cost reduction |
| Cargo planning | Weight distribution | Load optimization | Revenue increase |
| Route optimization | Fuel efficiency | Capacity utilization | Profit improvement |
| Equipment utilization | Asset efficiency | Revenue generation | ROI enhancement |
Systematic weight optimization improves operational efficiency and profitability.
Technology Integration
| Technology Application | Tare Monitoring | Payload Optimization | Operational Benefit |
|---|---|---|---|
| Weighing systems | Automatic tare capture | Real-time payload data | Accurate loading |
| Load planning software | Tare consideration | Optimal distribution | Efficiency improvement |
| Fleet management | Asset tracking | Utilization optimization | Cost control |
| Documentation systems | Weight verification | Compliance automation | Regulatory adherence |
Technology integration enables precise weight management and optimization.
Why Weight Understanding Matters
| Basic Weight Awareness | Comprehensive Weight Management |
|---|---|
| Simple capacity assumptions | Detailed component analysis |
| Generic loading practices | Optimized weight distribution |
| Basic cost calculations | Precise economic optimization |
Understanding weight components enables optimal cargo planning and cost management.
The Industry Shift Behind Weight Questions
| Traditional Weight Handling | Modern Weight Optimization |
|---|---|
| Basic capacity utilization | Scientific weight management |
| Simple loading practices | Engineered cargo distribution |
| Generic cost calculations | Precise economic analysis |
I increasingly see shipping operations implement sophisticated weight management systems that optimize tare weight efficiency, maximize payload utilization, and ensure regulatory compliance for enhanced operational performance and cost control.
Conclusion
At TRUSUS, I see container shipping knowledge evolving from basic capacity awareness toward comprehensive understanding of operational constraints, structural engineering principles, port efficiency factors, and weight optimization strategies for effective logistics management.
Success requires treating container shipping as a complex engineered system demanding systematic analysis of capacity utilization, operational efficiency, structural limitations, and economic optimization for competitive supply chain performance.
